Copenhagen promised to be carbon neutral by 2025. What happened, and what does it tell the cities aiming at 2030?
Copenhagen set itself the first carbon-neutral deadline of any capital, and 2025 has come and gone. Its own accounts show deep cuts, a list of sub-targets still short, and a last stretch that leaned on carbon capture that has not arrived. A hundred European cities now have a 2030 date; Amsterdam's own forecast already says it will miss its milestone. What the early movers learned about counting, money and the bets a plan quietly depends on.
2025 came and went
In 2012 Copenhagen’s city council adopted a plan to make the Danish capital carbon neutral by 2025, aiming to become the world’s first carbon-neutral capital. The promise went back to 2009, when the city hosted the UN climate summit, COP15. Rolling roadmaps for 2013–2016, 2017–2020 and 2021–2025 followed, each with its own measures and budgets.
The city’s carbon account for 2024, the last year before the deadline, puts its emissions at 668,797 tonnes of CO₂ equivalent, about 1.0 tonne for each resident. Then the account subtracts a credit for the renewable power and heat made by plants the city owns or part-owns. With the credit, the total falls to 455,737 tonnes, or 0.7 tonnes a resident.
The second number is the one that matters. The account says plainly that the 2025 neutrality target was set for the total including the credit. Measured that way, the fall has been steep: from 2,203,967 tonnes in 2005 to a figure 79.3% lower in 2024, while the population grew by roughly a fifth since 2009.
The chart traces both versions of the account: with the credit for every year since 2010, without it for the years the account still tabulates. Look for where the steepest drop sits.
tonnes CO₂e a year
Show the numbers
| With the renewables credit (the target’s measure) | Without the credit | |
|---|---|---|
| 2005 | 2,203,967 | 2,480,325 |
| 2010 | 2,128,599 | 2,431,520 |
| 2011 | 1,750,550 | — |
| 2012 | 1,606,045 | — |
| 2013 | 1,652,616 | — |
| 2014 | 1,421,694 | — |
| 2015 | 1,309,426 | — |
| 2016 | 1,433,361 | — |
| 2017 | 1,269,713 | — |
| 2018 | 1,284,304 | — |
| 2019 | 1,033,221 | — |
| 2020 | 671,095 | 956,526 |
| 2021 | 566,428 | 839,836 |
| 2022 | 548,518 | 831,857 |
| 2023 | 470,968 | 677,982 |
| 2024 | 455,737 | 668,797 |
Tonnes of CO₂ equivalent in the city’s own account. Without the credit, the account tabulates only 2005, 2010 and 2020–2024. The electricity factors were recalculated back to 2015 in 2023 and other methods have changed over the years, so read the long trend rather than single steps. Source: City of Copenhagen, CO2-regnskab for Københavns Kommune 2024
Most of the drop came from power and heat. Before any credit, electricity use emitted 1,223,333 tonnes in 2010 and 136,715 in 2024. Road traffic moved far less, from 381,035 tonnes to 272,888. After the credit, transport of all kinds makes up more than three-quarters of what is left.
The plan also set itself 19 sub-targets on the way, from cycling to rubbish sorting. The account reports their 2024 status and notes that they do not enter the headline calculation. Some were met: street lighting uses half the energy it did in 2010, and public transport carries 34% more passengers than in 2009. The chart shows nine that were still short.
Nine of the KBH 2025 plan’s 19 sub-targets, against their status in 2024. Where the plan set a range, the lower end is shown. The account notes that the sub-targets do not enter the calculation of whether the main target is met. Source: City of Copenhagen, CO2-regnskab for Københavns Kommune 2024
Cycling and public transport came within a few points. Waste sorting and heavy vehicles were nowhere near. A year before the deadline, nearly half a million tonnes were still on the books. What was supposed to close the gap?
The bet underneath the plan
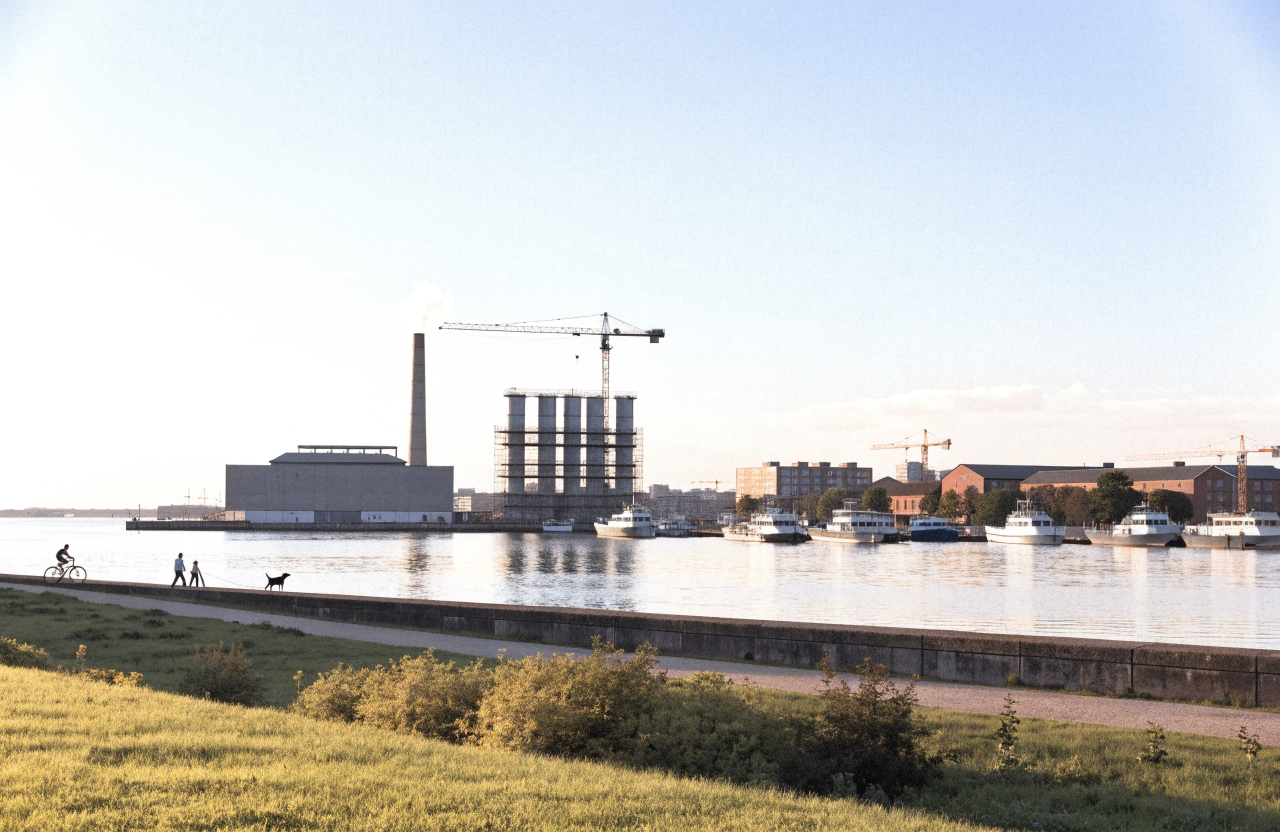
Two chimneys carry much of Copenhagen’s climate arithmetic. One rises from Amager Bakke, the waste-to-energy plant run by ARC. The other belongs to Amagerværket, the combined heat and power station of the city’s utility, HOFOR, which supplies about a quarter of the municipality’s district heating. Its Block 4, opened in 2020, burns wood, and it is Denmark’s largest single source of biogenic CO₂.
Capture that CO₂ and store it, and a plant burning wood would pull carbon out of the air: many hundreds of thousands of tonnes a year, by HOFOR’s estimate. The last stretch of the climate plan leaned on capture, and delays in carbon capture and storage are named as a main reason the 2025 goal proved so hard. Even on the original timetable, capture at Amager Bakke was due only “before 2030”, after the deadline had passed.
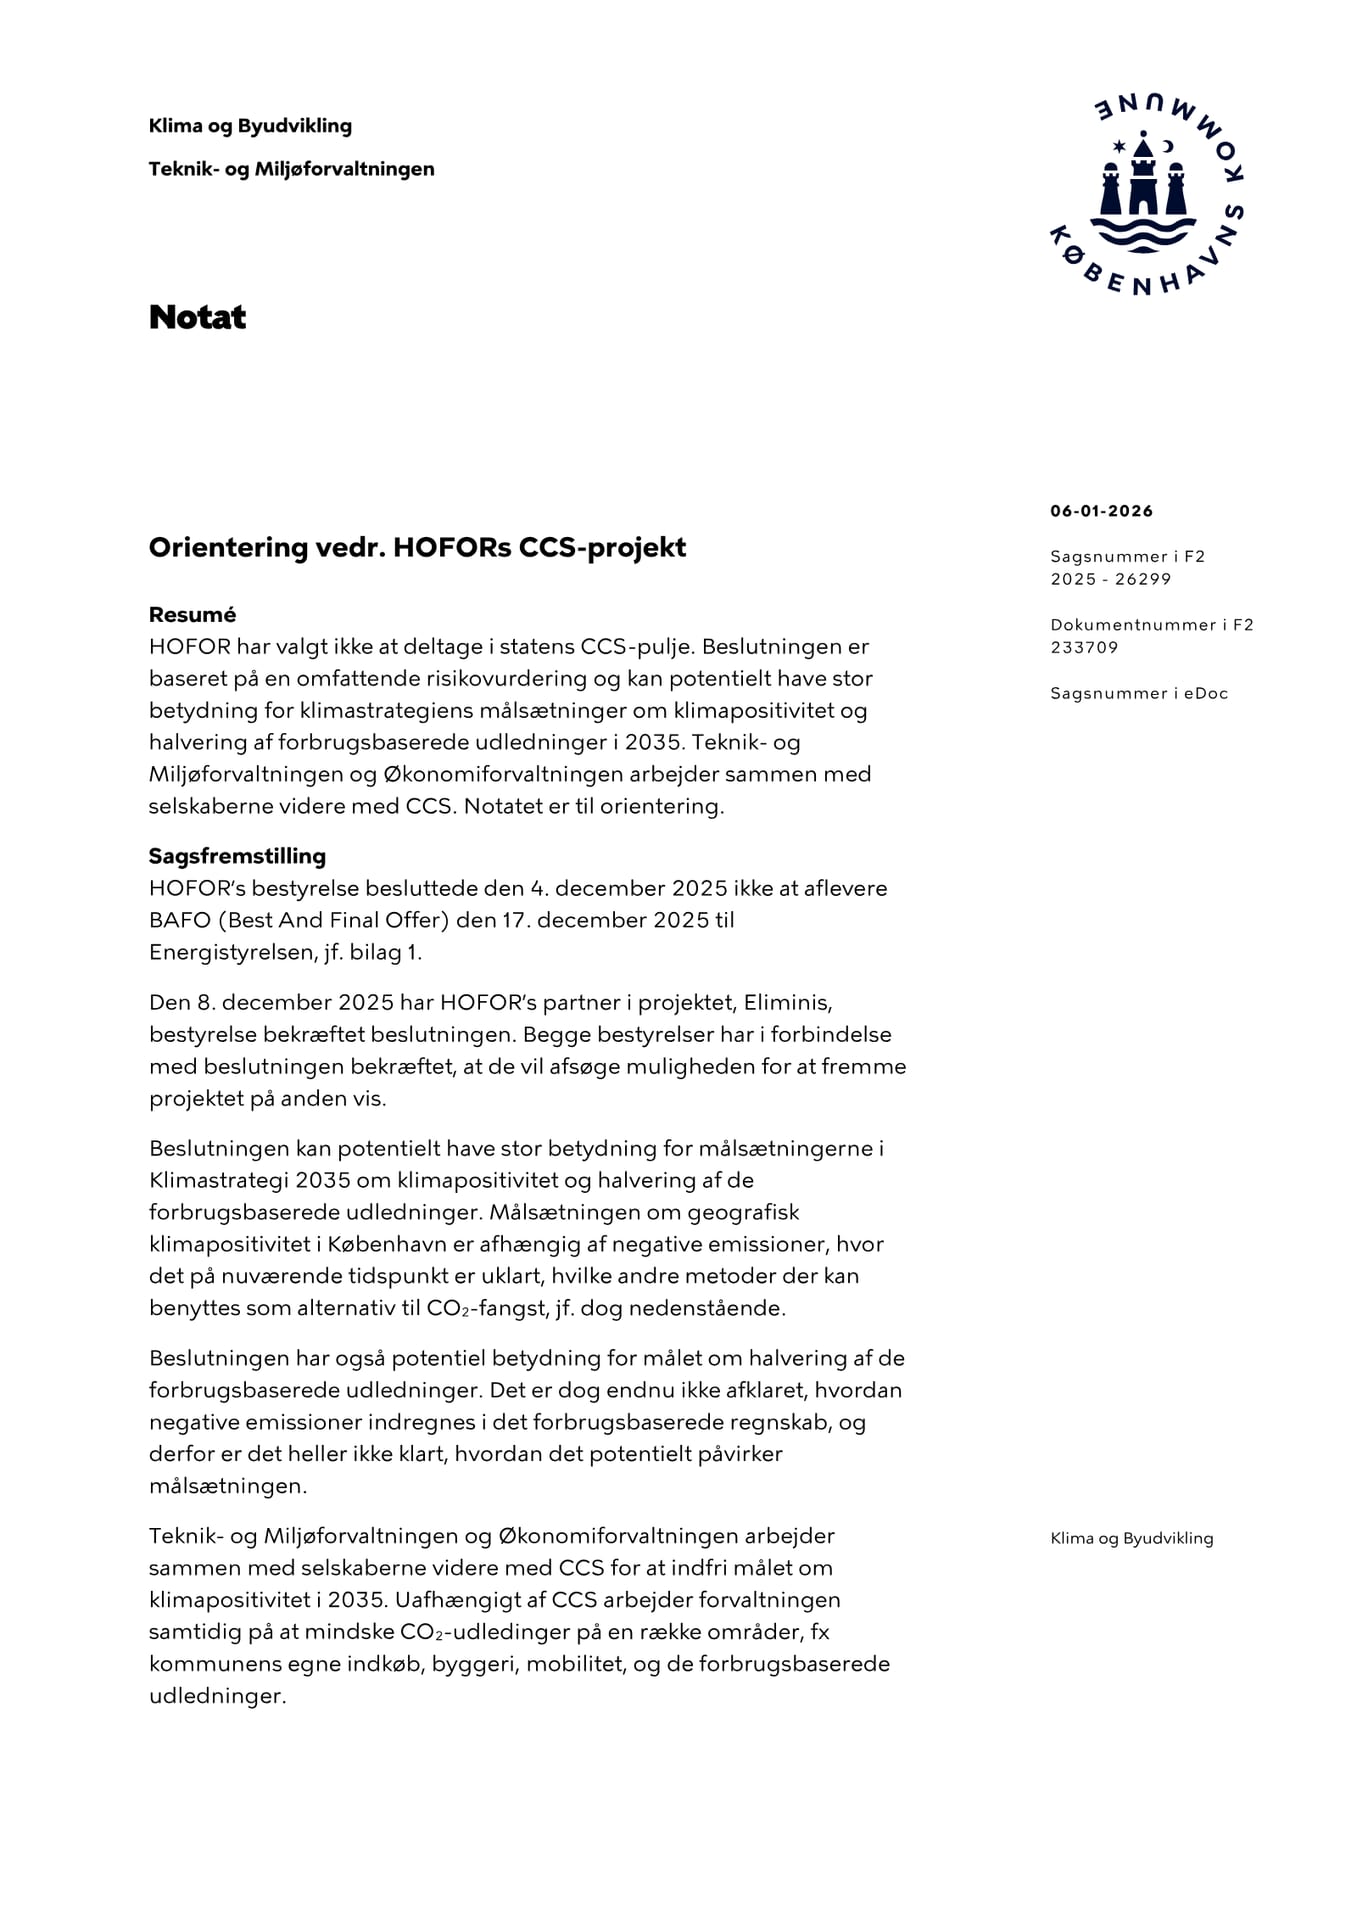
Then the bet came apart, in notes to the city’s committees. E.ON, the energy company that was to build capture at Amager Bakke with ARC, was prequalified in May 2025, with nine other companies, for the Danish state’s fund for carbon capture and storage. On 12 June the technical and environmental committee was told, in confidence, that the partnership had formally ended: E.ON had found that the business case did not add up. The bid deadline, 26 August, passed without a preliminary bid.
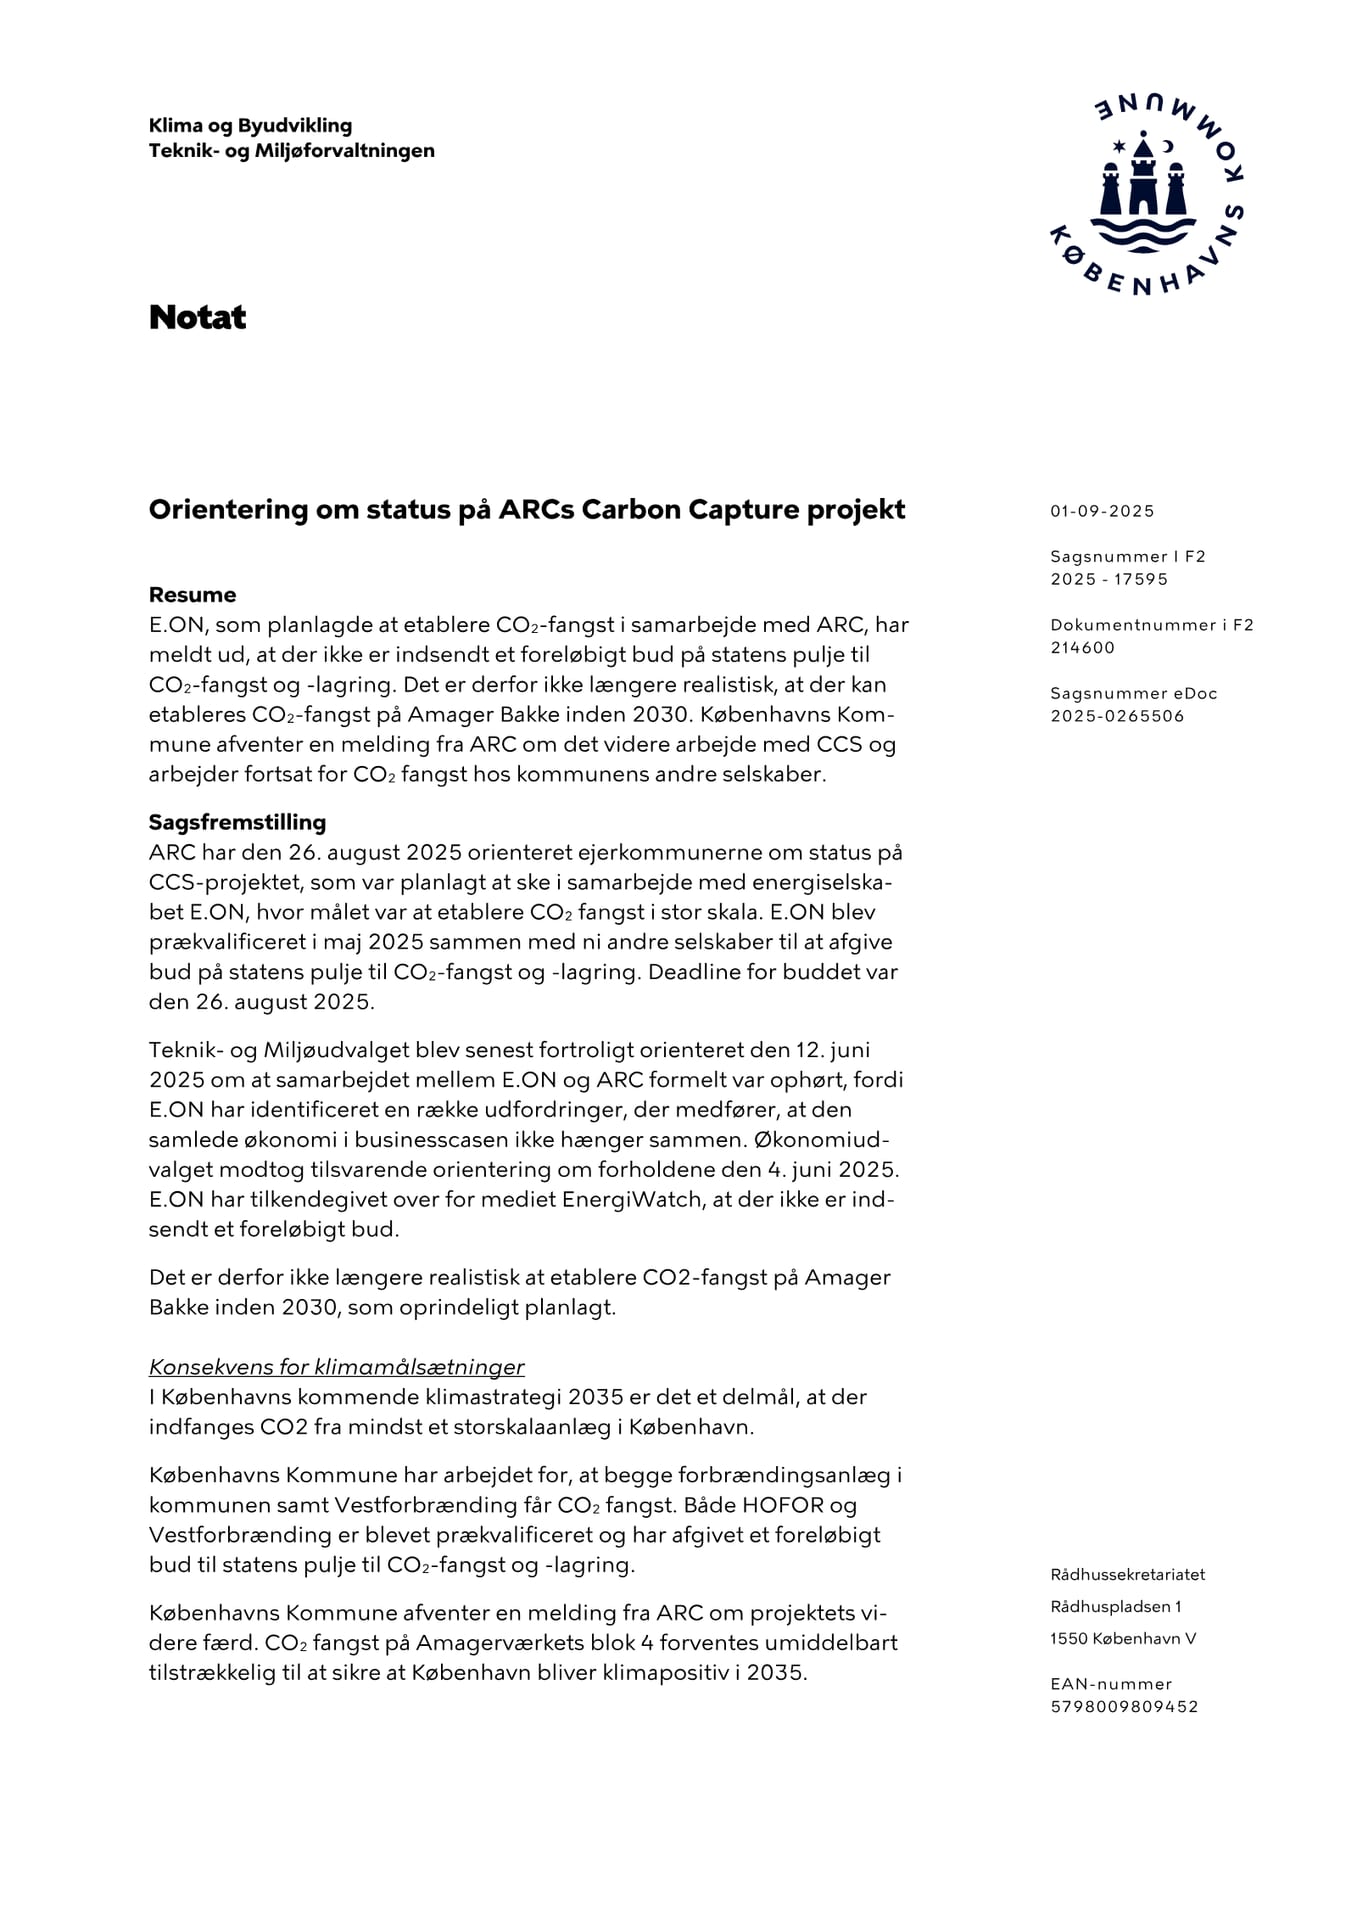
That left Amagerværket, and the city’s note of 1 September said capture on Block 4 was expected, on its own, to be enough for the next goal: a climate-positive city by 2035. On 4 December HOFOR’s board decided not to hand in its best and final offer to the Danish Energy Agency. Its reasons, in its own statement, were uncertainty about where the CO₂ would finally be stored, a tight timetable and large guarantees. The timeline puts the dates side by side; read the last two together.
- 2012[source]
The CPH 2025 Climate Plan is adopted
Three years after promising carbon neutrality at the COP15 summit, the city sets 2025 as the date, delivered through roadmaps for 2013–2016, 2017–2020 and 2021–2025.
- Jun–Aug 2025[source]
E.ON and ARC part ways
The capture partnership at Amager Bakke formally ends; the 26 August deadline for the state’s capture fund passes without a bid, and capture there before 2030 is no longer realistic.
- 18 Sep 2025[source]
Klimastrategi 2035 adopted
Neutrality gives way to a climate-positive city by 2035. In force from 1 January 2026.
- 4 Dec 2025[source]
HOFOR stands down
Its board decides not to submit a final offer for capture at Amagerværket; partner Elimini confirms on 8 December.
- End of 2027[source]
Storage decides, at the earliest
Final investment decision on Danish onshore CO₂ storage.
- 1 Jan 2030[source]
Capture must be running
The state tender’s requirement for the capture plant.
The capture bet at Copenhagen’s two big chimneys, as the city’s own notes record it. Both companies say they will keep working on capture outside the state’s fund.
A plant that had to run by 2030 could not wait for a store that would decide at the end of 2027 at the earliest.
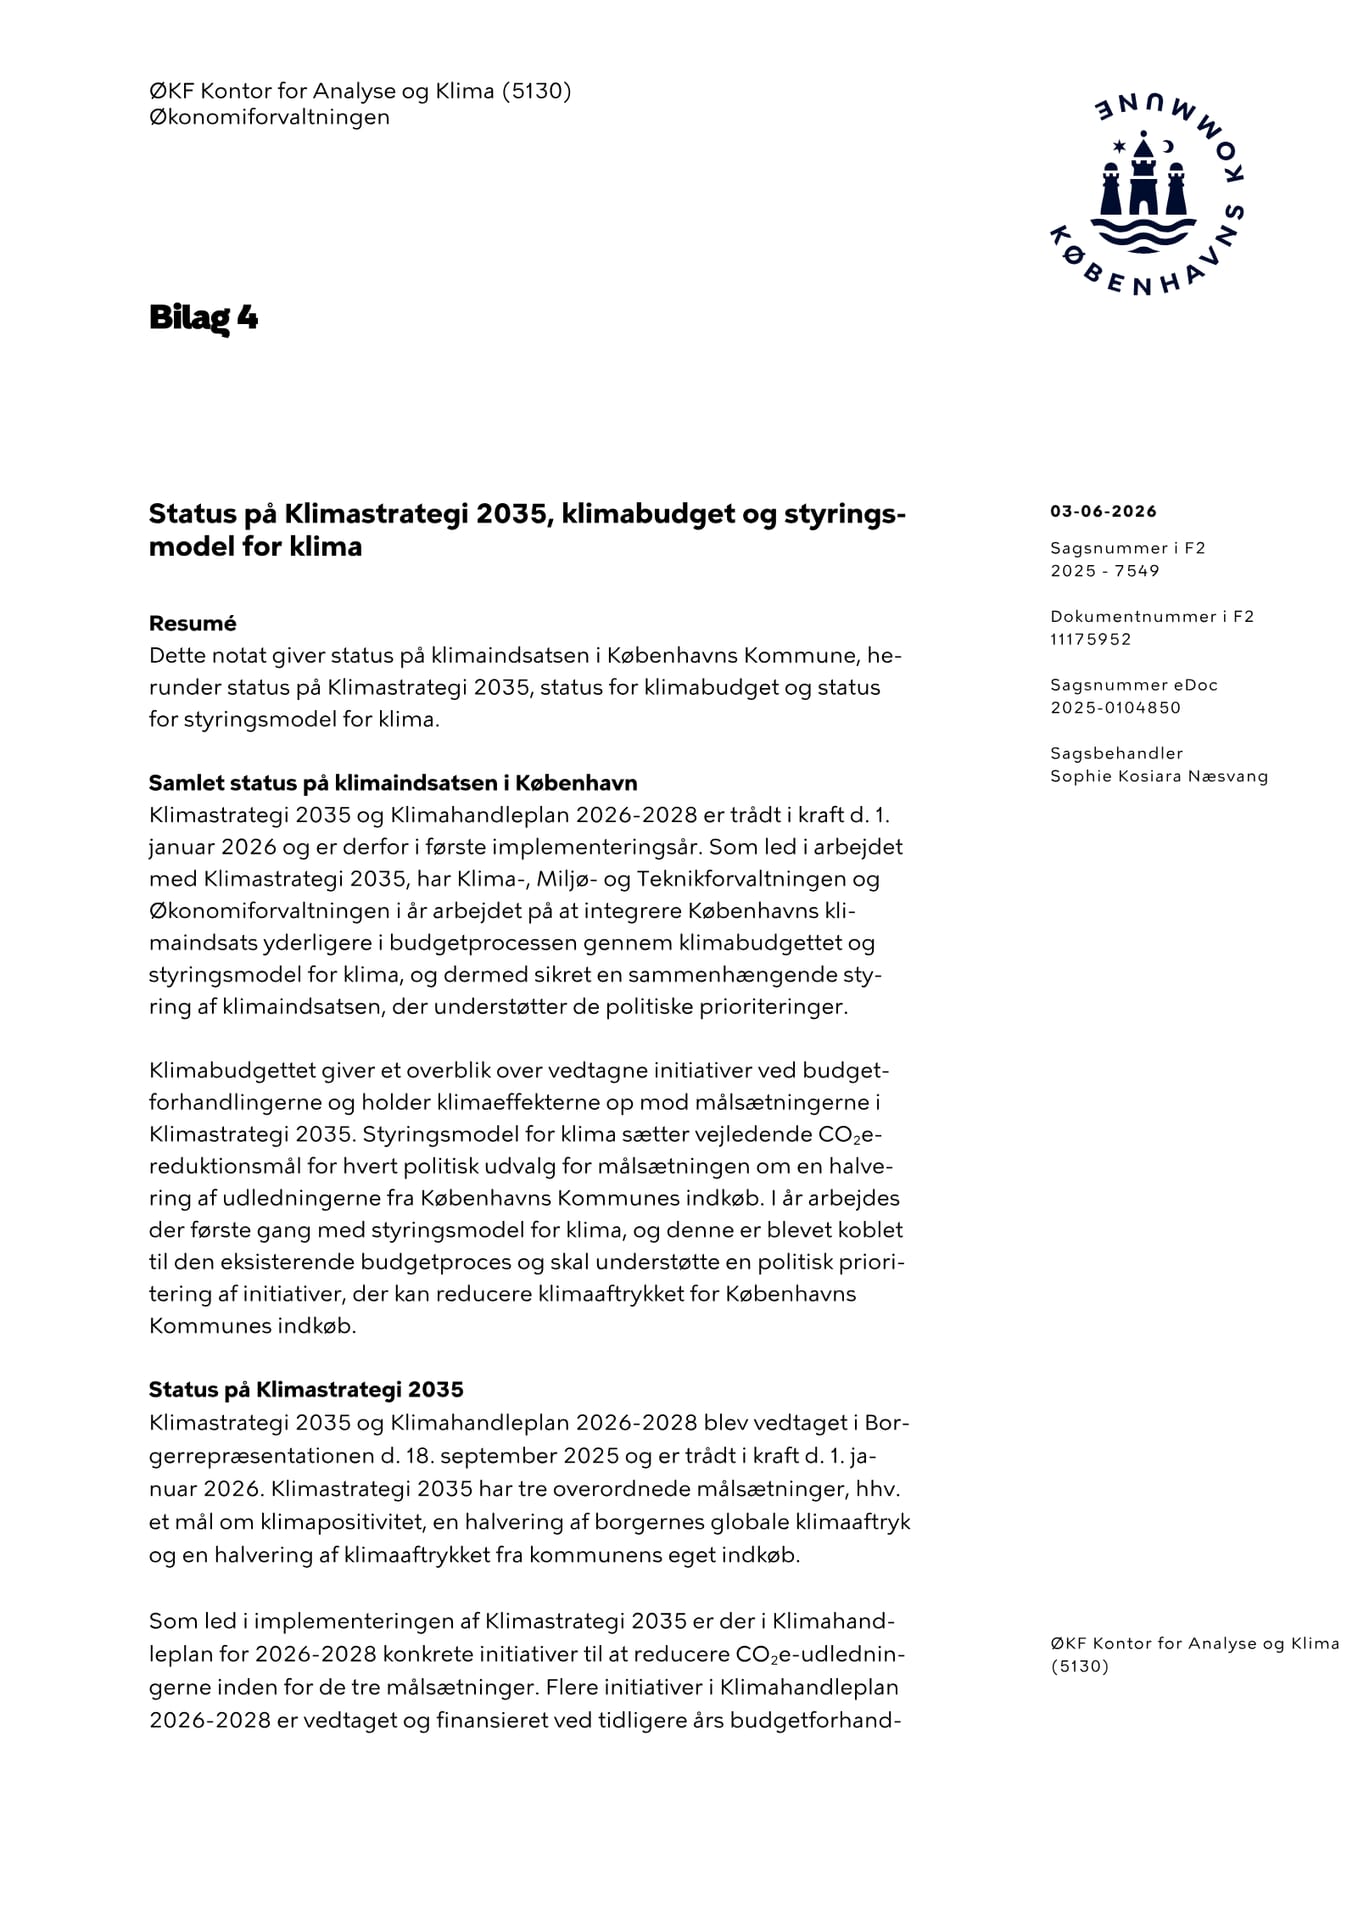
Meanwhile the city had moved its goalposts. Klimastrategi 2035, adopted on 18 September 2025, sets three new goals: a climate-positive city, half the global footprint of its citizens, and half the footprint of the council’s own purchasing. Climate positive means taking more carbon out than the city emits, which is exactly what capture was for. The first status report, in June 2026, expects territorial emissions roughly two-thirds below 2019 by 2035 with the measures already funded, and says positivity can be reached only if CO₂ capture is set up in Copenhagen before 2035. What else could deliver the negative emissions, the January note admits, is so far unclear.
Copenhagen is not alone. Stockholm’s plan needs negative emissions to exceed the city’s remaining emissions by 2030, and counts on capture at its Värtaverket plant to remove 800,000 tonnes a year. Amsterdam’s forecast assumes capture at the city’s waste incinerator zeroes one heat network’s emissions after 2028. And the UK government’s pathway, says the Climate Change Committee, relies on a steep scale-up of engineered removals. Every plan has a bet like this. Can you find the one in yours?
Two bottom lines: how a city counts its carbon
Copenhagen’s account has two bottom lines, and the gap between them is a decision. The city subtracts the renewable power, heat and gas made by plants inside its borders or part-owned by it: wind turbines, including 39 that HOFOR built in Jutland and on Lolland with a municipal loan guarantee, solar panels, and its 20.6% share of the Vestforbrænding incinerator. In 2024 the credit removed about two-thirds of the emissions from electricity use and 73% of those from district heating.
The chart shows what the credit does, source by source.
Copenhagen’s 2024 account before and after the renewables (VE) credit. The total also subtracts the carbon taken up by forest HOFOR has planted outside the city. Source: City of Copenhagen, CO2-regnskab for Københavns Kommune 2024
Without the credit, heat and power are the biggest emitters after road traffic; with it, they shrink to a fraction of what the roads emit. Nothing is hidden: the account prints both totals and its method. But other cities choose differently. CE Delft, which forecasts Amsterdam’s emissions, does not count the city’s own solar panels and turbines as a cut at all, because power flows across one national grid. Even inside one account, choices move numbers: Copenhagen splits the emissions of its combined heat and power plants between electricity and heat by the “200% method”, and its account calls the choice between that and the alternative “125% method” “primarily a political choice”.
Then there is what a city counts at all. Boston’s inventory leaves out goods and food made elsewhere and consumed by Bostonians, and about half of its cut since 2005 came from a cleaner regional grid. Philadelphia’s puts the city at 12.9 million tonnes for 2022, then shows its full total rising from 16.7 million to 20.6 million when greenhouse gases are weighed over 20 years rather than 100.
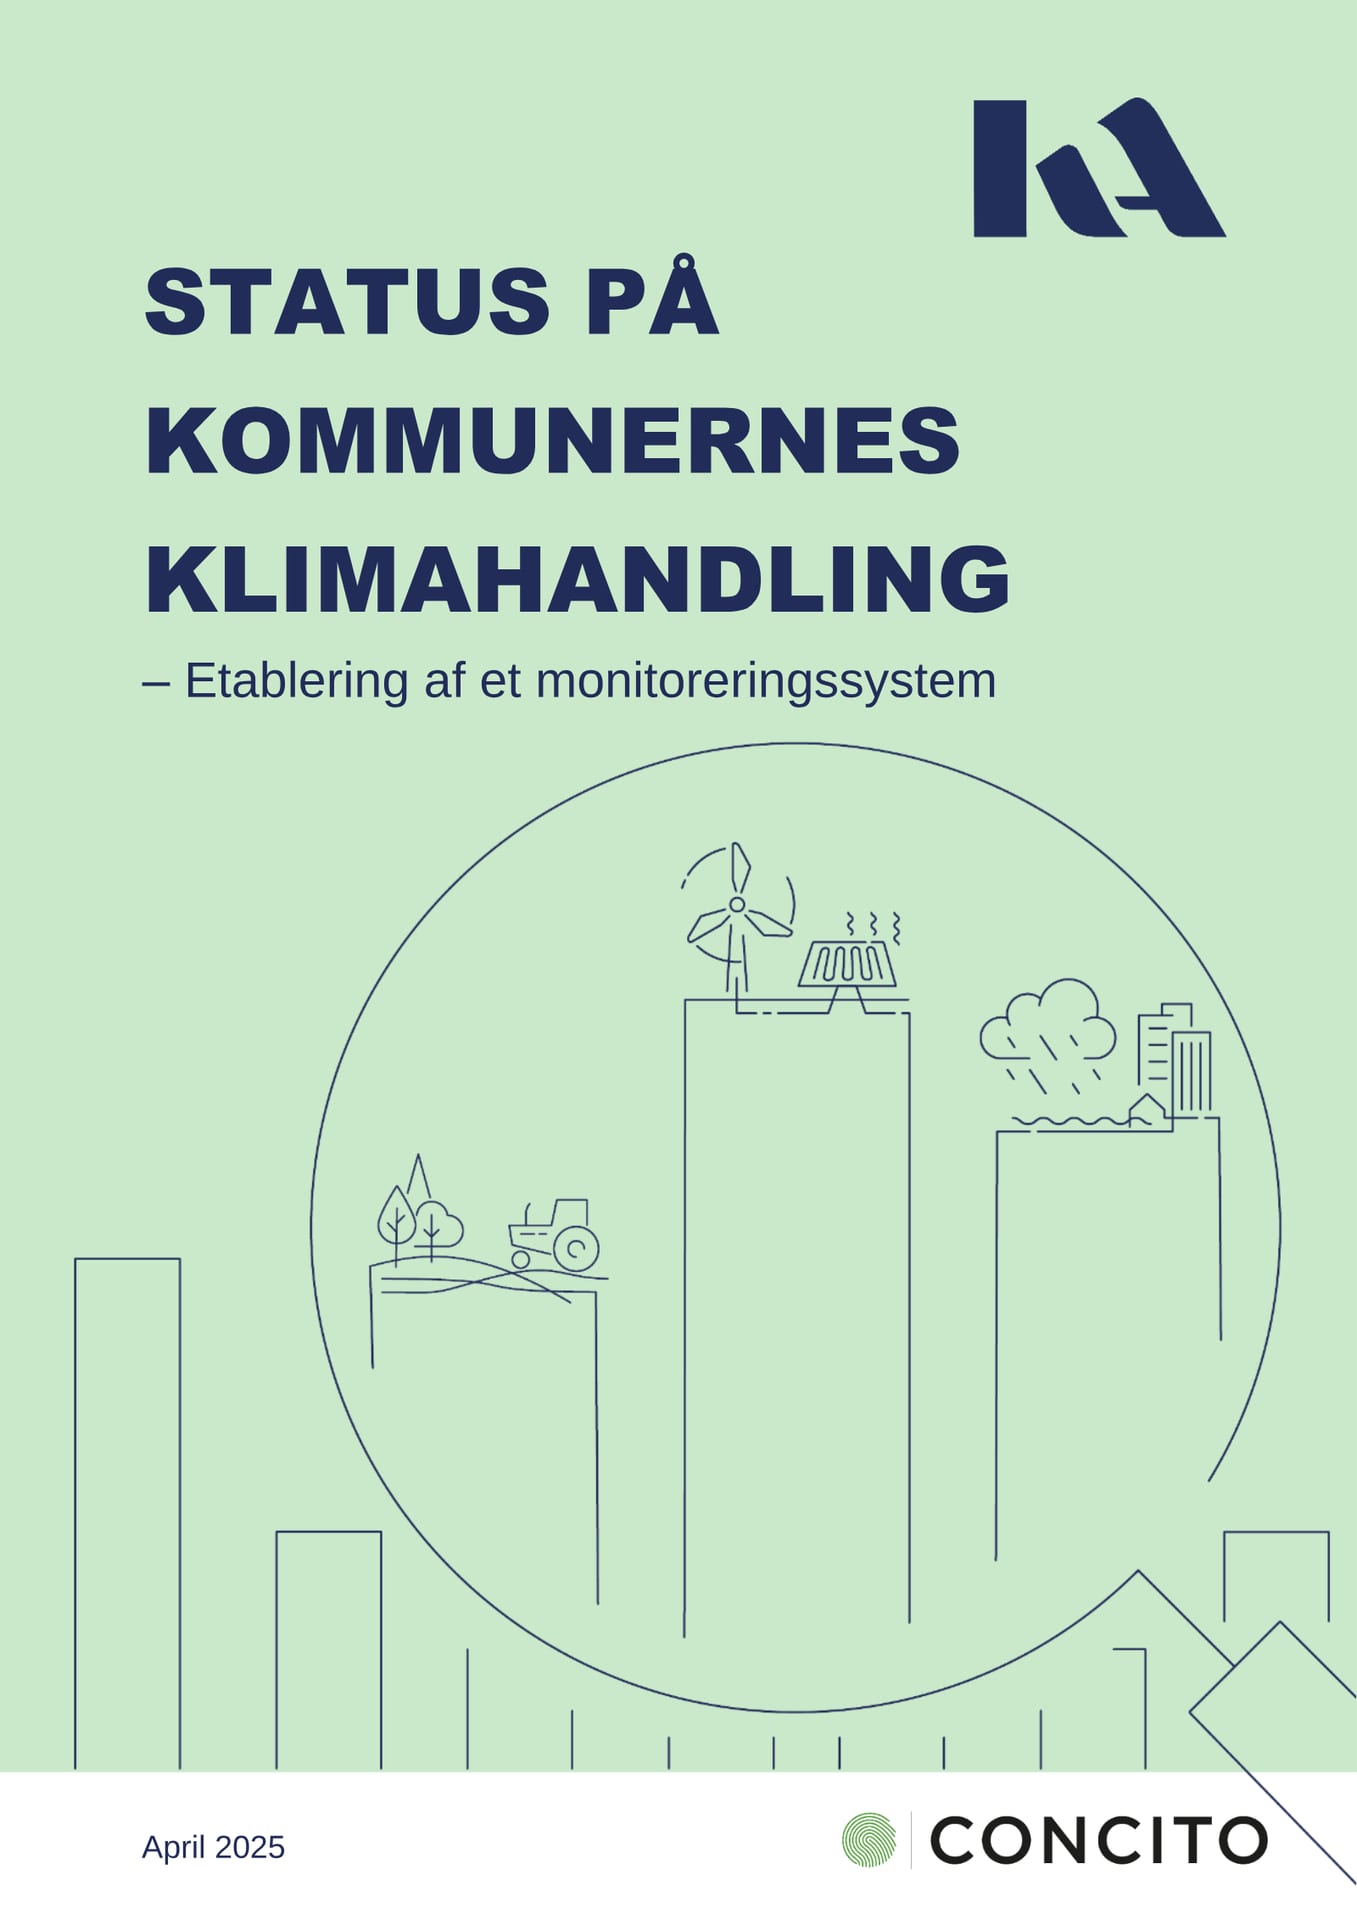
Most of all, a territorial account leaves out what people buy. Danish municipal targets cover only territorial emissions, notes CONCITO, the think tank building a common monitoring system for the municipalities: 96 of 98 had adopted climate action plans by the end of 2024. The average Dane’s consumption causes about 13 tonnes of CO₂e a year, roughly double the world average. That is why Copenhagen’s new strategy targets its citizens’ global footprint as well.
So handle comparisons with care. Amsterdam measures against 1990, Boston 2005, Philadelphia 2006, Tallinn 2007, Prague 2010; scopes, credits and warming horizons differ too. Compare a city with its own past first, and read the method before setting it beside anyone else.
The hundred cities with a 2030 date
In April 2022 the European Commission chose 112 cities from 377 applicants for its mission for 100 climate-neutral and smart cities by 2030, two decades ahead of the EU’s own 2050 goal. By October 2025, 103 had been awarded the mission label.

At the core is the climate city contract: commitments by the mayor, the council and local partners, an action plan and an investment plan, co-signed by national and regional authorities. NetZeroCities, a consortium of 33 partners, helps the cities write them. A contract is a plan, not a result, and the bill is large: the mission puts the investment needed across its cities in the hundreds of billions of euros.
Read closely, the dates mean different things. Warsaw’s contract aims for an 80% cut by 2030 in two pilot districts, Praga-Południe and Ursynów; city-wide its target is 40%, with neutrality in 2050, and heat from the EU’s largest district heating network still comes mainly from coal and gas. Stockholm aims to cut emissions from energy and transport by 80% against 1990 and to be climate positive by 2030. Tallinn commits to 40% below 2007 by 2030, Prague to 45% below 2010. Vienna has written neutrality by 2040 into law.

Amsterdam has had an outside forecaster check every year since 2020 whether it will arrive. CE Delft recalculates the city’s path to its goal of 60% below 1990 by 2030. The chart shows what each annual forecast expected.
% below 1990, expected in 2030
Show the numbers
| Expected cut by 2030 | |
|---|---|
| 2020 | 48 |
| 2021 | 37 |
| 2022 | 42 |
| 2023 | 48 |
| 2024 | 45 |
| 2025 | 46 |
The cut CE Delft’s forecast of each year expected Amsterdam to reach by 2030, against 1990. The 2021 dip followed a higher expected emission factor for electricity and a slower pace in buildings; from 2024 the forecast counts only policy already being carried out. Source: CE Delft, Raming Amsterdam klimaatneutraal – update 2025
The forecast has never come close. The 2025 update expects 46% and says the city would have to save another 540 kilotonnes to make it. Most of the cut it does expect is national: the emission factor of Dutch grid electricity falls by 78% between 2022 and 2030. The city’s own measures lag, above all the move of homes and offices off gas, whose pace has been revised down year after year.
Amsterdam’s new coalition for 2026–2030 keeps the goal and writes, in its agreement, that it needs “big steps from the cabinet”. The plans are written. Who pays for them?
Plans without purses
When Dublin City Council costed its priority projects to cut carbon in its two decarbonising zones, Ballymun and Ringsend–Poolbeg, the bill came to around €439 million. In July 2026 councillors heard that the Department of Climate had allocated €70,500, to be spent within the year, at least €8,000 of it on community engagement.
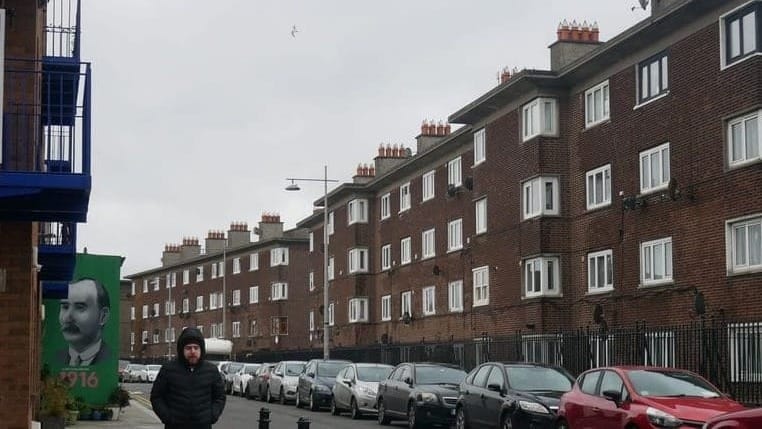
It’s not a lot of money.Irish law asks every council to choose one or two such zones and to target a 51% cut by 2030. Many of the measures in the plans, from active travel to bus electrification, fall to national bodies with budgets of their own.
Money is half of it; people are the other half. In Denmark, CONCITO found that half of municipalities had set aside money for their climate plans, and staffing varies enormously.
Full-time equivalents on climate work, as reported by the municipalities; they count them in different ways. Twenty municipalities have one person or none. Source: CONCITO, Status på kommunernes klimahandling (April 2025)
A plan written for every Danish municipality is carried out, in the typical one, by two people. And many levers sit above the city. CE Delft’s split for Amsterdam makes the city primarily responsible for gas heating in homes, shares non-residential buildings with the national government, and leaves motorways to the state, rural roads to the province and industrial process emissions to The Hague and Brussels. Its warning: heat networks are stuck until national legislation is settled, and the transition needs structural money from the state.
The national frames are slipping too. Germany’s Expertenrat für Klimafragen found in May 2026 that emissions fell by only 0.1% in 2025, as buildings and transport rose, and expects the budget to 2030 to be overshot by 60 to 100 million tonnes. In Britain, the Climate Change Committee finds emissions 50% below 1990 but a gap between the government’s plan, which reaches 65% by 2030, and the 68% the UK has pledged.
What do cities ask for? Rarely a new target. Dublin’s councillors asked to see “funding on the table” for projects they know will cut carbon; CONCITO asks for more resources and guidance; Amsterdam’s forecasters say the city needs laws and structural money from The Hague. Each wants the means to do what it has already promised.
Before your own deadline
Copenhagen cut deep, counted in the open and reported its setbacks to its committees as they came. Before your own deadline, ask your plan four questions.
- What does the headline count? Find the total your target is measured against and every credit inside it. Copenhagen’s account prints both; yours should too.
- What is the bet? Name the project the last stretch depends on, the date it must work and the date the things it needs are decided. The HOFOR note shows what happens when those dates cross.
- Who holds the money and the levers? Split what is left into what the city controls, what it shares and what sits with the state, as CE Delft did for Amsterdam, and cost each part.
- Who checks you? An outside forecast every year, like Amsterdam’s, tells you early enough to change course.
Then look sideways. Compare cities and countries sets places side by side, and the city profiles of Copenhagen, Amsterdam, Stockholm and Warsaw gather their plans and sources. If your city is working to a deadline, join the Hub’s community on the participate page and say which one: the most useful peer is often a city that has already hit the same wall.
References
From our libraries20
- CPH 2025 Climate Plan — Knowledge
- CO2-regnskab for Københavns Kommune 2024 — Knowledge
- Orientering vedr. HOFORs CCS-projekt (Teknik- og Miljøforvaltningen, 6 Jan 2026) — Knowledge
- Orientering om status på ARCs Carbon Capture projekt (Teknik- og Miljøforvaltningen, 1 Sep 2025) — Knowledge
- Status på Klimastrategi 2035, klimabudget og styringsmodel for klima (Økonomiforvaltningen, 3 Jun 2026) — Knowledge
- Stockholm Climate Action Plan 2030 — Knowledge
- Raming Amsterdam klimaatneutraal – update 2025 (CE Delft) — Knowledge
- Progress in reducing emissions — 2026 report to Parliament (Climate Change Committee, June 2026) — Knowledge
- Boston's Carbon Emissions — 2005–2023 community and municipal GHG inventory (City of Boston) — Knowledge
- 2022 City of Philadelphia Greenhouse Gas Inventory — Knowledge
- Status på kommunernes klimahandling — Etablering af Klimaalliancens fælles monitoreringssystem (april 2025) — Knowledge
- EU Mission: 100 Climate-Neutral and Smart Cities by 2030 — Knowledge
- NetZeroCities (EU Cities Mission Platform) — Knowledge
- Warsaw Net Zero Cities Mission — Knowledge
- Tallinn Climate-Neutral Roadmap 2030 — Knowledge
- Prague Climate Plan 2030 — Knowledge
- Vienna Climate Guide (Wiener Klimafahrplan) — Knowledge
- Jouw stad is mijn stad. Coalitieakkoord 2026–2030 PRO Amsterdam en D66 Amsterdam — Knowledge
- In need of €439 million to reduce carbon emissions, the council got €70,500 (Dublin Inquirer, 31 Jul 2026) — Knowledge
- Expertenrat für Klimafragen: Prüfbericht zu den Emissionsdaten 2025 und den Projektionsdaten 2026 (press release, 18 May 2026) — Knowledge
Further sources5
- City of Copenhagen, CPH 2025 Climate Plan — City of Copenhagen, CPH 2025 Climate Plan · 2012
- City of Copenhagen, Orientering om status på ARCs Carbon Capture projekt (1 Sep 2025) — City of Copenhagen, Orientering om status på ARCs Carbon Capture projekt (1 Sep 2025) · Jun–Aug 2025
- City of Copenhagen, Status på Klimastrategi 2035 (3 Jun 2026) — City of Copenhagen, Status på Klimastrategi 2035 (3 Jun 2026) · 18 Sep 2025
- City of Copenhagen, Orientering vedr. HOFORs CCS-projekt (6 Jan 2026) — City of Copenhagen, Orientering vedr. HOFORs CCS-projekt (6 Jan 2026) · 4 Dec 2025
- Darby Mullen, senior executive engineer, Dublin City Council, at the council’s climate action committee, July 2026 — Darby Mullen, senior executive engineer, Dublin City Council, at the council’s climate action committee, July 2026