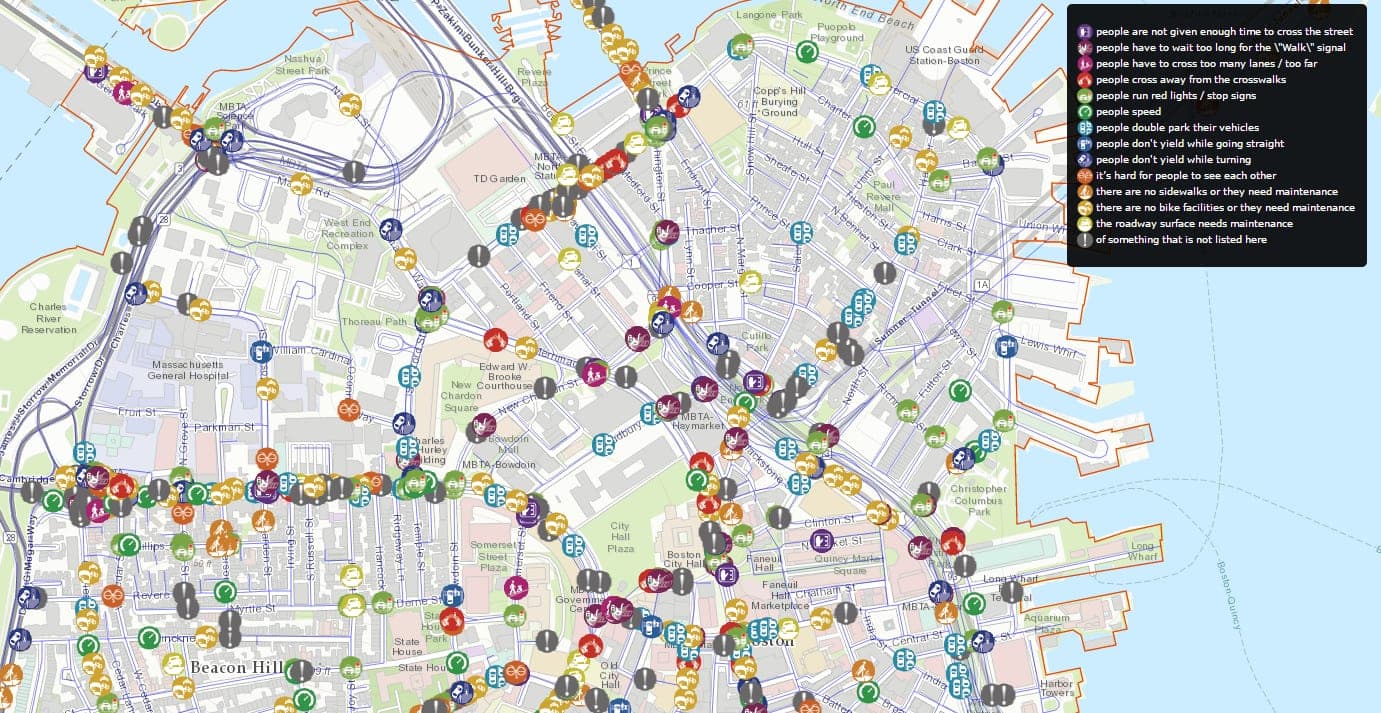
Boston’s Vision Zero map brings crash records and residents’ safety concerns into a public-facing tool intended to support the city’s goal of eliminating fatal and serious traffic crashes by 2030. The map is part of a wider program that also offers crash dashboards and a channel for people to report street-safety issues. 234
The crash records are compiled by the City’s Department of Innovation and Technology from its 911 Computer-Aided Dispatch system. They include the date, time, location and type of incidents that prompted a public-safety response; fatality records are separately verified by the Boston Police Department. The city uses EMS responses as a consistent proxy for injury crashes, while noting that the records do not establish the severity of an individual incident. 211
Residents can mark a location and describe a concern, which the Transportation Department says it uses when deciding how to make streets safer during redesigns. The safety-concerns dataset is based on submissions to the city’s application. 412 The map’s crash data has also informed analysis of high-crash corridors: Boston’s 2023 action plan says the city created its first High Crash Network in 2019 using crash-density analysis, then updated it in 2023 with data from 2017–2020. 11
The project grew from Boston’s Vision Zero commitment, which the city joined in 2015; the interactive map launched the following year. In its first six months, it received more than 11,000 safety reports, according to a 2017 account quoting Joyce John of the city’s Department of Innovation and Technology, who oversaw the project. 13 The city’s current page says the Vision Zero tool has been updated, but the supplied page excerpt does not specify what changed. 2